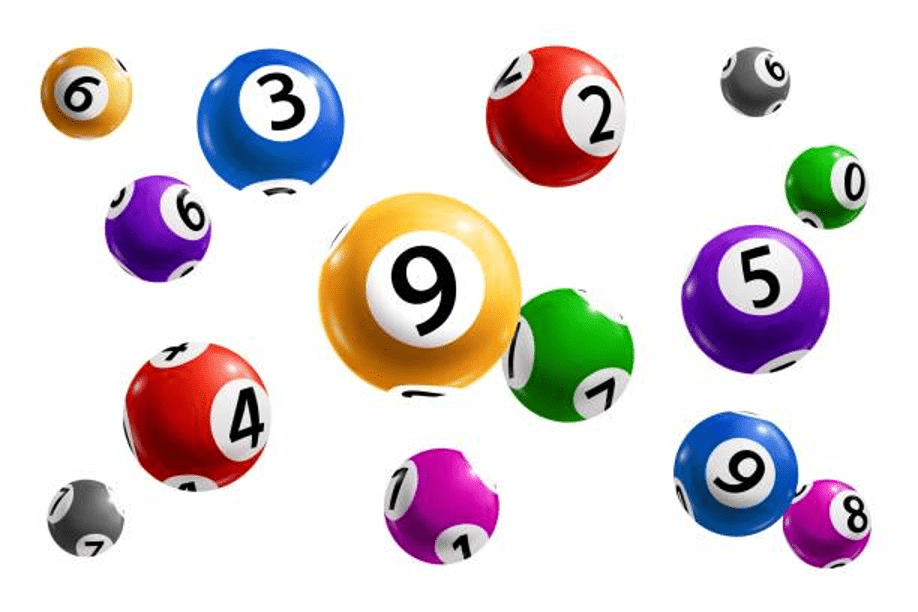
Keno is a number lottery game ranging from 1 to 80. 20 random numbers are picked during each draw. Although picked randomly, players usually search for “hot” digits that come out more often, although each number actually has an equal probability of being picked during each round.
Frequently Drawn Keno Numbers
A number of compiled studies note a typical roster of commonly pulled Keno numbers:
- 1, 4, 23, 34, and 72 are commonly reported as being called for the most in online Keno.
- Other research adds 3, 12, 27, 31, 32, 35, 40, 49, 50, and 65 to the list, with 27 appearing as one of the highest frequency numbers.
- A broader consensus list includes 1, 2, 4, 23, 27, 34, 35, 40, 50, 65, and 72.
Additional Numbers Identified


Further investigations have added other numbers to the “most frequent” category:
- Some analyses name 3, 16, 44, 58, and 78 in addition to the commonly cited group.
- Others point out 32, 39, and 64 as first results, plus 11, 53, 7, 67, 20, 19, and 61
Interpreting “Hot” Numbers
Other versions of Keno can also influence which numbers appear most over time. Regional lottery forms, online casino Keno, and mechanical machine raffles can all possess different frequency tables as a result of their own independent history of drawings and operation.
Games played, draw schedule, and even types of equipment all can influence which of the number combinations are more likely to appear over time. For this reason, a list of commonly occurring numbers from one variant isn’t necessarily an exact duplicate of another.
Game Variant Differences
Although certain figures appear more regularly in historical data, due to a RNG or mechanical draw, Keno maintains each number’s odds of being selected equal per draw. “Hot” figures refer to statistical prevalence over a period of time, not future predictive capability.
Every draw is independent, and no earlier frequency increases a number’s likelihood of reappearing.
Summary of Reported Frequent Numbers
A combined list of frequently reported Keno numbers includes:
- Consistently cited: 1, 4, 23, 34, 72
- Also frequently named: 3, 12, 27, 31, 32, 35, 40, 49, 50, 65
- Other less-common but still reported: 16, 44, 58, 78
- Additional data-driven picks: 32, 39, 64, 11, 53, 7, 67, 20, 19, 61
Practical Implications for Players
Since each draw of Keno is an independent event, the results of previous draws have no bearing on future outcomes. Although players may like to choose from proven selections for personal gratification or superstitions, this action doesn’t alter the true probability of the outcome.
The most useful strategy for trying to get successful keno or lottery results is to determine a number-selecting strategy that fits individual tolerance for risk and purposes of entertainment instead of basing strategy purely on frequency tables.
No Predictive Advantage
Selecting “hot” numbers, which can be identified on https://lottopark.com/results/, does not offer a statistical advantage. Each draw is independent and all numbers share equal probability. Frequent-draw data is retrospective and does not influence future outcomes.
Players can still select these numbers as a matter of individual playing behavior, but the selection is not mathematically justified for odds increases.
Strategy Guidelines
General guidelines for Keno number selection often focus on balancing risk and reward rather than relying on frequent numbers. Common recommendations include:
- Selecting 4 to 8 of your lucky numbers to balance payout possibilities with achievable risk.
- Choosing fewer numbers, like 2 to 4, can provide more frequent little victories.
- You choose additional numbers, 5 to 8, for example, which would give you fewer frequent wins but larger wins when you do win.
These approaches discuss risk tolerance instead of relying on certain figures.
Observations on Number Clustering
Some historical Keno data shows that frequently drawn numbers can appear in clusters. For instance, some sequences 31, 32, 34, 35 can occur more frequently than would be typical during an analysis of an extensive draw history.
Although clustering behavior can be seen, it is a result of pure random chance and not a reproducible predicting tool.
Variability Over Time
The list of hottest, most frequently selected numbers may vary over time since the lottery is a random draw. A commonly occurring number in one set may be average in another. This creates an uncertainty that ensures any “hot” list is always unique for that particular time span and collection of game conditions from which it is derived.
Although research and analysis may reflect a greater incidence in repeat history; however, Keno is still a random game with an equal probability of each number being picked in each draw. Playing “hot” numbers is subjective and not a factual strategy for winning.
When playing, choosing a moderate number of picks—typically 4 to 8—is a good balance between payout capability and win frequency.
 Bertha Richardonner is the dedicated author of Gamble Wise Roots, where she provides readers with in-depth insights into the gambling world. Her platform offers essential news and updates, simplifies casino basics, and breaks down the intricacies of odds.
Bertha’s passion for uncovering the history and evolution of casino games, along with her exploration of betting origins, empowers enthusiasts to approach gaming with greater knowledge and understanding.
Bertha Richardonner is the dedicated author of Gamble Wise Roots, where she provides readers with in-depth insights into the gambling world. Her platform offers essential news and updates, simplifies casino basics, and breaks down the intricacies of odds.
Bertha’s passion for uncovering the history and evolution of casino games, along with her exploration of betting origins, empowers enthusiasts to approach gaming with greater knowledge and understanding.